Note
Go to the end to download the full example code.
Acoustic fingerprinting and graphical soundscapes
Acoustic fingerprinting is a technique that captures unique features of audio signals. For example, Shazam employs a spectrogram-based approach, converting audio into a visual representation and then identifying peaks on the spectrogram [1]. This fingerprint is matched against a vast database to identify the corresponding song. The method is robust in presence of noise, allowing accurate recognition of diverse audio sources in real-time. This approach is versatile, finding application in characterizing soundscapes. It has been successfully employed to evaluate FSC forest certification [2] and Neotropical oil palm landscapes [3].
Load required modules
from maad import sound, util, rois, features
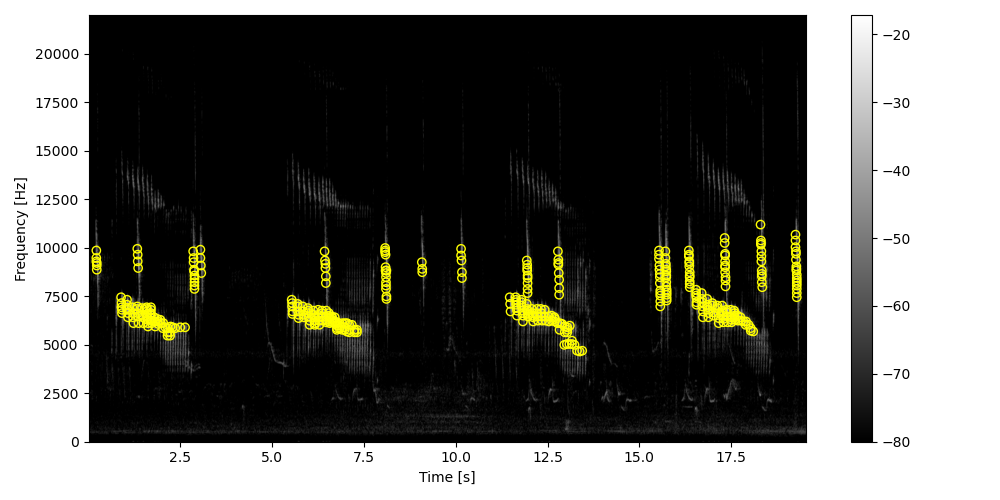
Local maxima on spectrograms
Load the audio file, get the spectrogram, and compute the local maximas.
Graphical soundscapes
If we compute the local maxima over multiple audio recordings from the same site, we can have a graphical representation of the most prominent spectro-temporal dynamics over a 24-hour window. To illustrate this, we will use 96 audio recordings that were collected in a temperate forest, and that are available here.
df = util.get_metadata_dir('../../data/indices')
df['time'] = df.date.dt.hour
gs = features.graphical_soundscape(
    data=df, time='time', threshold_abs=-80, target_fs=22000, verbose=False)
ax = features.plot_graph(gs)
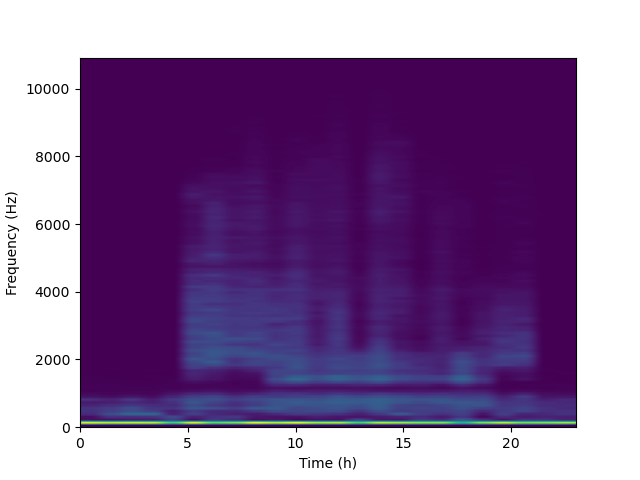
This representation can be computed at various locations, and comparisons can be made among these sites for similarity. For further details on this approach, refer to sources [2] and [3]. It is important to note that the method implemented in scikit-maad is akin but not identical. In the original approach, peaks were calculated based on the mean spectrogram. In this version, we identify local maxima directly within the spectrogram.
References
[1] Wang, A. (2003, October). An industrial strength audio search algorithm. In Ismir (Vol. 2003, pp. 7-13).
[2] Campos‐Cerqueira, M., Mena, J. L., Tejeda‐Gómez, V., Aguilar‐Amuchastegui, N., Gutierrez, N., & Aide, T. M. (2020). How does FSC forest certification affect the acoustically active fauna in Madre de Dios, Peru?. Remote Sensing in Ecology and Conservation, 6(3), 274-285.
[3] Furumo, P. R., & Mitchell Aide, T. (2019). Using soundscapes to assess biodiversity in Neotropical oil palm landscapes. Landscape Ecology, 34, 911-923.
Total running time of the script: (0 minutes 1.311 seconds)