Note
Go to the end to download the full example code.
Download metadata from Xeno-Canto to infer species activities
The goal of this example is to show how to download metadata from Xeno-Canto to infer species activities. We focus on the activity of european woodpeckers.
Dependencies: To execute this example you need to have installed pandas package.
(from https://woodpeckersofeurope.blogspot.com/2007/11/drumming.html) Woodpeckers of Europe 10 species of woodpecker (Picidae) breed in Europe: 9 resident species and the migratory Wryneck. 8 of these 10 also occur outside Europe, with the distribution of Eurasian Three-toed, White-backed, Lesser Spotted, Great Spotted, Black & Grey-headed Woodpeckers stretching eastwards from the Western Palearctic into Asia, whilst Syrian is found in the Middle East & Asia Minor & Wryneck winters in Africa. The global ranges of Green & Middle Spotted Woodpeckers are confined to the Western Palearctic.
Eurasian Three-toed : Picoides tridactylus White-backed : Dendrocopos leucotos Lesser Spotted : Dryobates minor Great Spotted : Dendrocopos major Black : Dryocopus martius Grey-headed : Picus canus Syrian : Dendrocopos syriacus Wryneck : Jynx torquilla Green : Picus viridis Middle Spotted : Dendrocoptes medius
# sphinx_gallery_thumbnail_path = './_images/sphx_glr_plot_xenocanto_woodpecker_activities_002.png'
import pandas as pd
import matplotlib.pyplot as plt
import numpy as np

from maad import util
Query Xeno-Canto
array with english name and scientific name of all european woodpeckers
data = [['Eurasian Three-toed', 'Picoides tridactylus'],
        ['White-backed',        'Dendrocopos leucotos'],
        ['Lesser Spotted',          'Dryobates minor'],
        ['Great Spotted',       'Dendrocopos major'],
        ['Black',                   'Dryocopus martius'],
        ['Grey-headed',             'Picus canus'],
        ['Syrian',              'Dendrocopos syriacus'],
        ['Wryneck',             'Jynx torquilla'],
        ['Green',               'Picus viridis'],
        ['Middle Spotted',      'Dendrocoptes medius']]
creation of a dataframe for the array with species names
get the genus and species needed for Xeno-Canto
Build the query dataframe with columns paramXXX gen : genus cnt : country area : continent (europe, america, asia, africa) q : quality (q_gt => quality equal or greater than) len : length of the audio file (len_lt => length lower than; len_gt => length greater than ) type : type of sound : ‘song’ or ‘call’ or ‘drumming’ Please have a look here to know all the parameters and how to use them : https://xeno-canto.org/help/search
Get recordings metadata corresponding to the query
df_dataset = util.xc_multi_query(
    df_query=df_query,
    format_time=True,
    format_date=True,
    verbose=True
    )
Loading page 1...
https://www.xeno-canto.org/api/2/recordings?query=Picoides%20tridactylus%20type:drumming%20area:europe&page=1
Keeped metadata for 242 files after formating time
Keeped metadata for 160 files after formating date
Found 1 pages in total.
Saved metadata for 160 files
Loading page 1...
https://www.xeno-canto.org/api/2/recordings?query=Dendrocopos%20leucotos%20type:drumming%20area:europe&page=1
Keeped metadata for 185 files after formating time
Keeped metadata for 131 files after formating date
Found 1 pages in total.
Saved metadata for 131 files
Loading page 1...
https://www.xeno-canto.org/api/2/recordings?query=Dryobates%20minor%20type:drumming%20area:europe&page=1
Loading page 2...
https://www.xeno-canto.org/api/2/recordings?query=Dryobates%20minor%20type:drumming%20area:europe&page=2
Keeped metadata for 513 files after formating time
Keeped metadata for 395 files after formating date
Found 2 pages in total.
Saved metadata for 395 files
Loading page 1...
https://www.xeno-canto.org/api/2/recordings?query=Dendrocopos%20major%20type:drumming%20area:europe&page=1
Loading page 2...
https://www.xeno-canto.org/api/2/recordings?query=Dendrocopos%20major%20type:drumming%20area:europe&page=2
Keeped metadata for 881 files after formating time
Keeped metadata for 638 files after formating date
Found 2 pages in total.
Saved metadata for 638 files
Loading page 1...
https://www.xeno-canto.org/api/2/recordings?query=Dryocopus%20martius%20type:drumming%20area:europe&page=1
Keeped metadata for 341 files after formating time
Keeped metadata for 254 files after formating date
Found 1 pages in total.
Saved metadata for 254 files
Loading page 1...
https://www.xeno-canto.org/api/2/recordings?query=Picus%20canus%20type:drumming%20area:europe&page=1
Keeped metadata for 102 files after formating time
Keeped metadata for 75 files after formating date
Found 1 pages in total.
Saved metadata for 75 files
Loading page 1...
https://www.xeno-canto.org/api/2/recordings?query=Dendrocopos%20syriacus%20type:drumming%20area:europe&page=1
/Users/jsulloa/miniconda3/envs/maad/lib/python3.11/site-packages/maad/util/xeno_canto.py:144: SettingWithCopyWarning:
A value is trying to be set on a copy of a slice from a DataFrame

See the caveats in the documentation: https://pandas.pydata.org/pandas-docs/stable/user_guide/indexing.html#returning-a-view-versus-a-copy
  df_dataset['time'][df_dataset.time.str.match('^([0-9])[:]([0-5][0-9])$')] = '0' + df_dataset[df_dataset.time.str.match('^([0-9])[:]([0-5][0-9])$')].time
Keeped metadata for 33 files after formating time
Keeped metadata for 28 files after formating date
Found 1 pages in total.
Saved metadata for 28 files
Loading page 1...
https://www.xeno-canto.org/api/2/recordings?query=Jynx%20torquilla%20type:drumming%20area:europe&page=1
Found 1 pages in total.
Saved metadata for 0 files
Loading page 1...
https://www.xeno-canto.org/api/2/recordings?query=Picus%20viridis%20type:drumming%20area:europe&page=1
Keeped metadata for 35 files after formating time
Keeped metadata for 22 files after formating date
Found 1 pages in total.
Saved metadata for 22 files
Loading page 1...
https://www.xeno-canto.org/api/2/recordings?query=Dendrocoptes%20medius%20type:drumming%20area:europe&page=1
/Users/jsulloa/miniconda3/envs/maad/lib/python3.11/site-packages/maad/util/xeno_canto.py:144: SettingWithCopyWarning:
A value is trying to be set on a copy of a slice from a DataFrame

See the caveats in the documentation: https://pandas.pydata.org/pandas-docs/stable/user_guide/indexing.html#returning-a-view-versus-a-copy
  df_dataset['time'][df_dataset.time.str.match('^([0-9])[:]([0-5][0-9])$')] = '0' + df_dataset[df_dataset.time.str.match('^([0-9])[:]([0-5][0-9])$')].time
Keeped metadata for 26 files after formating time
Keeped metadata for 19 files after formating date
Found 1 pages in total.
Saved metadata for 19 files
Creation of a dataframe with the number of files per species per 30mins
Using the metadata collected from Xeno-Canto, we create a new dataframe containing the number of files per species and per time slot (30 mins). The goal is to create a dataframe with diel pattern of activity for all species with a time resolution of 30 mins.
# make a copy of the dataset to avoid any modification of the original dataset
df = df_dataset.copy()
# remove all rows where data is missing (NA)
df.dropna(
    subset=['time'],
    inplace=True
    )
# Convert time into datetime
df['time'] = pd.to_datetime(
    arg=df['time'],
    format="%H:%M"
    )
New dataframe with the number of audio files per time slot. The period of the time slot is 30 min
df_count = pd.DataFrame()
list_species = df['en'].unique()
for species in list_species :
    df_temp = pd.DataFrame()
    df_temp['count'] = df[df['en']==species].set_index(['time']).resample('30T').count().iloc[:,0]
    df_temp['species'] = species
    df_count = pd.concat([df_count, df_temp])

# create a column with time only
df_count['time'] = df_count.index.strftime('%H:%M') # type: ignore
/Users/jsulloa/github/scikit-maad/example_gallery/2_advanced/plot_xenocanto_woodpecker_activities.py:130: FutureWarning: 'T' is deprecated and will be removed in a future version, please use 'min' instead.
  df_temp['count'] = df[df['en']==species].set_index(['time']).resample('30T').count().iloc[:,0]
Creation of a dataframe with the number of files per species per week
Using the metadata collected from Xeno-Cant, we create a new dataframe containing the number of files per species and per week. The goal is to create a dataframe with annual pattern of activity for all species with a week (7 days) resolution.
# make a copy of the dataset to avoid any modification of the original dataset
df = df_dataset.copy()

# remove all rows where data is missing (NA)
df.dropna(
    subset=['week'],
    inplace=True
    )
New dataframe with the number of audio files per week
df_week_count = pd.DataFrame()

list_species = df['en'].unique()

for species in list_species :
    df_temp = pd.DataFrame()
    df_temp['count'] = df[df['en']==species].set_index(['week']).index.value_counts()
    df_temp['species'] = species
    df_week_count = pd.concat([df_week_count, df_temp])

# create a column with time only
df_week_count["week"] = df_week_count.index
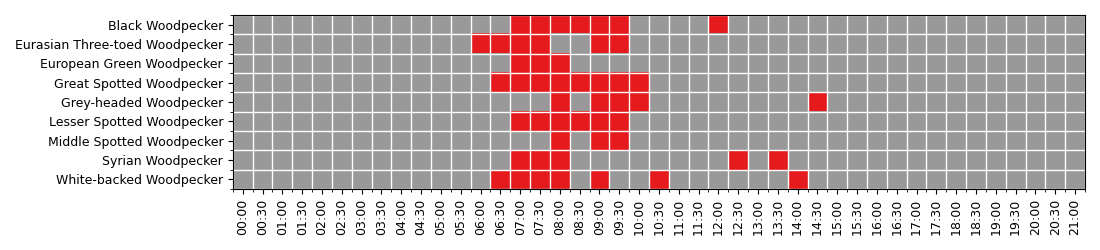
Display a heatmap of diel activity
make a copy of the dataset to avoid any modification of the original dataset
df = df_count.copy()
find the number of counts that corresponds to 50% of the counts
for species in list_species:
    # find the threshold value
    count_50_threshold = df[df_count['species']==species]['count'].sum()*(0.50)
    # extract the counting value of the category
    aa = df[df_count['species']==species]['count'].values
    # sort the counts (ascending)
    aa.sort()
    # reverse the order (descending)
    aa = aa[::-1]
    # find the index where the cumulative sum of the count is higher
    idx = np.where(aa.cumsum() >= count_50_threshold)[0]
    aa[idx[0]]
    df.loc[(df_count['species'] == species) & (df['count']< aa[idx[0]]), 'count'] = 0
    df.loc[(df_count['species'] == species) & (df['count']>=aa[idx[0]]), 'count'] = 1
Display the heatmap to see when (time of the day) the woodpeckers are active. Woodpeckers are the most active during the morning, between 6:00am till 10:00am.
df = df.pivot(index='species', columns='time', values='count')
df = df.fillna(0)

# plot figure
fig = plt.figure(figsize= (11,2.5))
ax = fig.add_subplot(111)
ax.imshow(df, aspect="auto", interpolation="None", cmap="Set1_r")

# Major ticks
ax.set_xticks(np.arange(0, len(list(df)), 1))
ax.set_yticks(np.arange(0, len(df.index), 1))

# Labels for major ticks
ax.set_xticklabels(
    list(df),
    fontsize=9,
    rotation=90
    )
ax.set_yticklabels(
    df.index,
    fontsize=9
    )

# Minor ticks
ax.set_xticks(
    np.arange(-0.5, len(list(df)), 1),
    minor=True)

ax.set_yticks(
    np.arange(-0.5, len(df.index), 1),
    minor=True)

# Gridlines based on minor ticks
ax.grid(
    which='major',
    color='w',
    linestyle='-',
    linewidth=0
    )

ax.grid(
    which='minor',
    color='w',
    linestyle='-',
    linewidth=1
    )

fig.tight_layout()
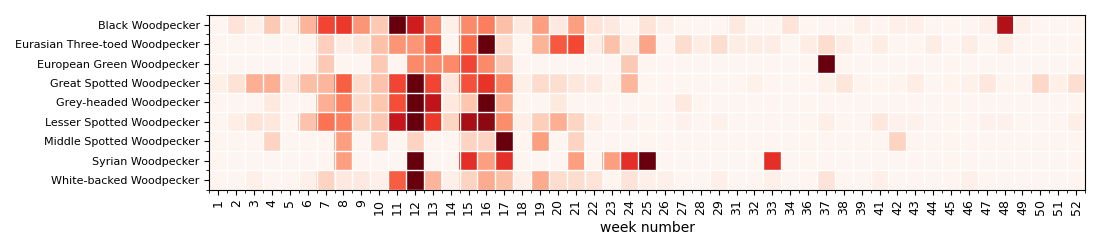
Display a heatmap of annual activity with week resolution
make a copy of the dataset to avoid any modification of the original dataset
df = df_week_count.copy()
create a new dataframe with the normalized number of audio files per week
df['count'] = df['count'].astype(float)

for species in list_species:

    # scale the count values using MinMaxScaler
    scaled_counts = df[df['species'] == species]['count'] / np.max(df[df['species'] == species]['count'])

    # update the original DataFrame with scaled count values
    df.loc[df['species'] == species, 'count'] = scaled_counts
Display the heatmap to see when (annually) the woodpeckers are active. Woodpeckers are the most active during the winter and beginning of spring (Februrary to April).
df = df.pivot(
    index='species',
    columns='week',
    values='count')
df = df.fillna(0)

# plot figure
fig = plt.figure(figsize=(11,2.5))
ax = fig.add_subplot(111)

ax.imshow(
    df,
    aspect="auto",
    interpolation="None",
    cmap="Reds"
    )

# Major ticks
ax.set_xticks(np.arange(0, len(list(df)), 1))
ax.set_yticks(np.arange(0, len(df.index), 1))

# Labels for major ticks
ax.set_xticklabels(list(df),
                fontsize=9,
                rotation=90)
ax.set_yticklabels(df.index,
                fontsize=8)

# Minor ticks
ax.set_xticks(
    np.arange(-0.5, len(list(df)), 1),
    minor=True
    )

ax.set_yticks(
    np.arange(-0.5, len(df.index), 1),
    minor=True
    )

# Gridlines based on minor ticks
ax.grid(
    which='major',
    color='w',
    linestyle='-',
    linewidth=0)

ax.grid(
    which='minor',
    color='w',
    linestyle='-',
    linewidth=1
    )

# add the title of the x-axis
ax.set_xlabel("week number")

fig.tight_layout()
Total running time of the script: (1 minutes 23.869 seconds)